Back To Latest Articles

U.S. hotel commentary – June 2023

June 2023 Top-Line Metrics (percentage change from June 2022)

  • Occupancy: 69.7% (-0.4%)
  • Average daily rate (ADR): US$158.40 (+2.3%)
  • Revenue per available room (RevPAR): US$110.33 (+1.9%)


Key points

  • U.S. hotel demand declined slightly year over year, but modest supply growth helped mitigate the impact on occupancy.
  • Another month of moderate ADR growth (+2.3%) led RevPAR to rise 1.9%.
  • Normalization continues to be the theme of U.S. hotel performance, as weekend occupancy declined, and weekday occupancy increased relative to 2022.
  • Chain-scale performance further supports normalization, as high-end (Luxury/Upper Upscale) hotel demand grew, and Midscale/Economy hotel demand declined in June. 
  • Luxury chains reported further softening in ADR as the balance between Luxury and Upper Upscale ADR slowly reverts to the longer-term average.
  • Transient demand growth outpaced group demand growth for the first time since early 2021 as the group demand equation included a difficult year-over-year comparison. 
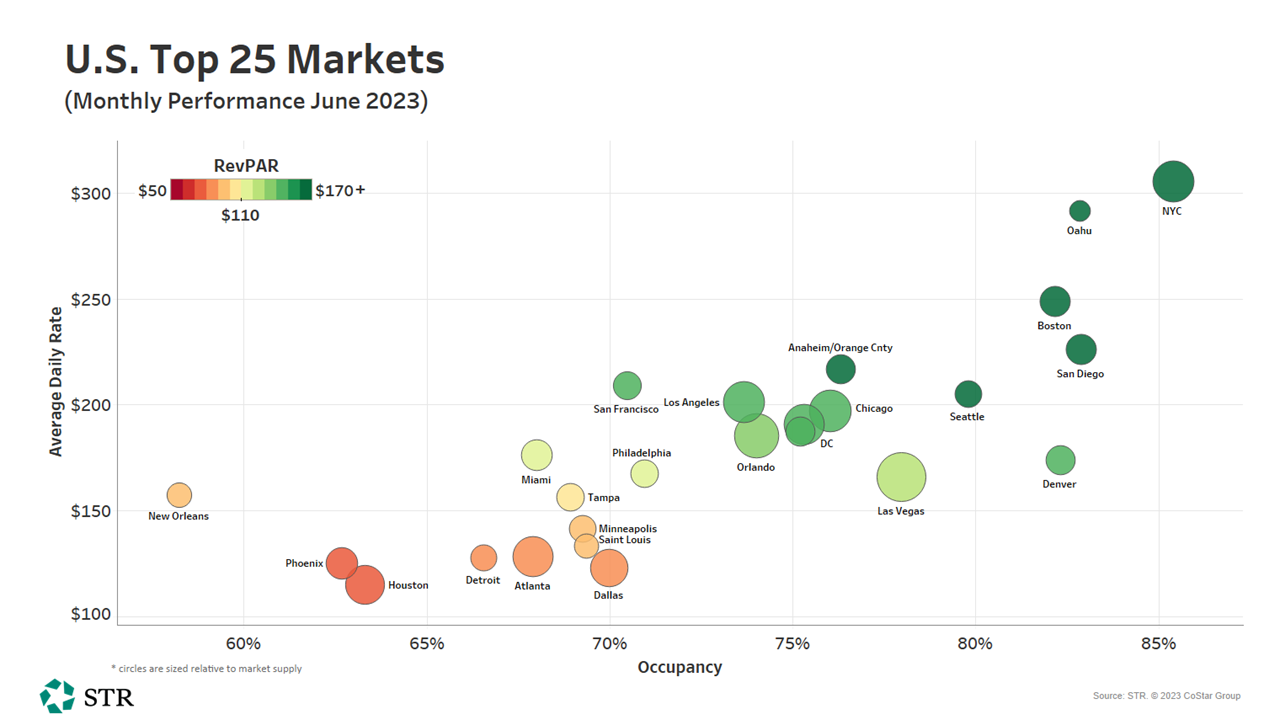
  • The Top 25 Markets continued to be a demand bright spot, growing 0.6% in June and 0.7% for the quarter.  
  • The volume of rooms under construction remained stable.


The modest occupancy decline, which was underpinned by a 0.1% demand decline, moderated pricing power.

After an unexceptional start to the summer, U.S. hotel demand declined 0.5% year over year for the second quarter. Supply growth, or lack thereof, provided modest upside, and occupancy dipped only 0.7% as the U.S. added just 15,000 rooms (+0.2% from Q2 2022).

Excluding 2020, when demand declined in all four quarters, this was the country’s first quarterly demand decline since 2009.

However, unlike 2009 hotel demand, which declined in all four quarters as a result of the Great Recession, the 2023 loss comes as a result of the industry’s continued post-pandemic normalization.

Occupancy declines in Q2 2023 were concentrated primarily over weekends, which outperformed in 2022 as “revenge travel” swept the U.S. on Sundays and Thursdays. Those “shoulder days” did well as a result of work-from-anywhere policies and long weekends.

With return-to-office producing headlines and business travel picking up pace in 2023, shoulder-day growth has moderated over the leisure-heavy summer months, and occupancy growth has been more concentrated on weekdays.

Chain Scales

Scale-level data supports the normalization trend as well. Luxury, Upper Upscale, and Upscale chains, all of which welcome a high preponderance of business travelers, reported the strongest year-over-year growth levels.

At the same time, the more leisure-driven Midscale and Economy chains reported year-over-year demand declines for each month of the second quarter.

ADR trends further support the normalizing travel trends across the U.S. Q2 2023 ADR growth decelerated across all seven chains, in part because Q2 2022 ADR fully recovered relative to 2019, meaning that year-over-year growth was clear of any COVID recovery comparisons.

The marked deceleration of U.S. inflation further underpinned the softer ADR growth.

For Luxury chains, a year-over-year ADR decline, while modest, is helping to restore the balance between Luxury and Upper Upscale ADR levels. That balance, which normally produces a 175% premium for Luxury hotel rates in June, peaked at 230% in 2021 and reached 196% in June 2023.

Markets

While total U.S. demand declined in Q2 2023, the Top 25 Markets represented a significant bright spot for the industry, with year-over-year growth reported each month of the quarter.

The Top 25 Markets’ continued strength comes entirely from weekday travel, as similar to the U.S. nationally, Top 25 Market weekend occupancy declined in Q2.

US Top 25 occ June 2023


US non Top 25 June 2023


Top 25 Market demand continued to rise, increasing 0.6% year over year as other market demand fell 0.5% from 2022. At the same time, ADR growth across the market segments was roughly equal.

Top 25 ADR grew 2.2% year over year, just slightly below other markets’ 2.3% growth level, although Top 25 ADR as indexed to 2019 continued to trail all other markets’ index. At the market level, all but four markets reported year-over-year growth, and most reported rate gains greater than the Top 25 average. San Francisco, New Orleans, and Miami were the primary causes of the slower year-on-year growth, as all three markets reported ADR declines worse than 6%.

Pipeline

The number of rooms under construction remained stable at approximately 150,000, marking the 19th consecutive month with a level between 150-160k. Year-over-year growth in construction remains largely flat, and there is little expectation that will change in the near-term.

Longer-term development suggests more hotel rooms are headed outside of the Top 25 Markets, but in the near-term, Top 25 and Other Market rooms are nearly equally split.

Latest weekly data

After the normal softness around the Fourth of July, U.S. occupancy rebounded to 72.0%, which was an increase of 10.2 percentage points (ppts) week over week. That was the highest WoW gain thus far in 2023 and the third highest since March 2020. Occupancy was basically flat (+0.1%) year over year but down nearly 2ppts versus the same week in 2019. Read more here.